
The Fed is NOT coming to save you: what’s Plan B?
After the Fed’s gut punch of “don’t expect rate cuts anytime soon”, it’s clear there’s no immediate term safety net. Investors are rocked and the market is whipsawing. What should your next move be?

After last week’s wild market swings, the inbox questions came rolling in:
What happened?
Why did the S&P 500 spike and then sink?
Are we headed into recession territory, or is this just another pullback?
Let’s get into it.
What Triggered the Market’s Short-Lived Rally?
The week started off with a bounce. The S&P 500 rallied Monday on optimism that incoming tariffs might not hit as hard as expected.
But that was short-lived.
By Wednesday, the administration announced 25% tariffs on auto imports and effectively popped the bubble of hope that had lifted markets just days before.
Then came Friday’s gut punch: the PCE inflation report, the Fed’s preferred gauge, came in hotter than expected.
Yes, bond yields fell. But that wasn’t a “risk-on” move, it was more of a flight to safety. Increasingly, major financial institutions are raising the probability of a recession.
So, here’s the behavioral takeaway:
Investors lost confidence in the idea that the Fed would step in with rate cuts.
And when that belief dies, the safety net vanishes.
Why Is the 200-Day Moving Average So Important?
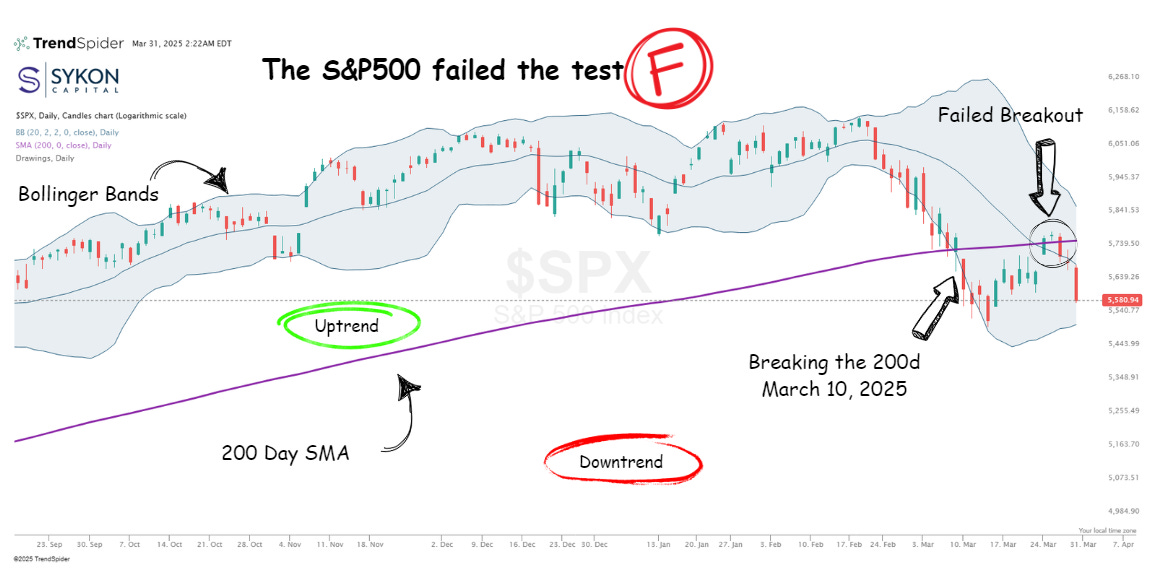
Let’s zoom out. The real story isn’t just inflation or tariffs, it’s the technical failure sitting on the S&P 500 chart.
Last Monday’s bounce ran right into the 200-day simple moving average (SMA) and failed hard.
That matters.
Because in market regimes, the 200-day SMA is more than just a line, it’s potentially a signal. When the index is above that line, we tend to see stronger upside momentum.
Below it, the risk profile often shifts.
And right now, we’ve given back all the gains since September 2024. That’s not just noise.
It’s potentially a regime change.
What Does the Data Say About the 200-Day SMA?
Let’s look at history.
From 1989 to 2024, the S&P 500 has shown a better volatility profile when trading above its 200-day moving average compared to when it’s trading below.
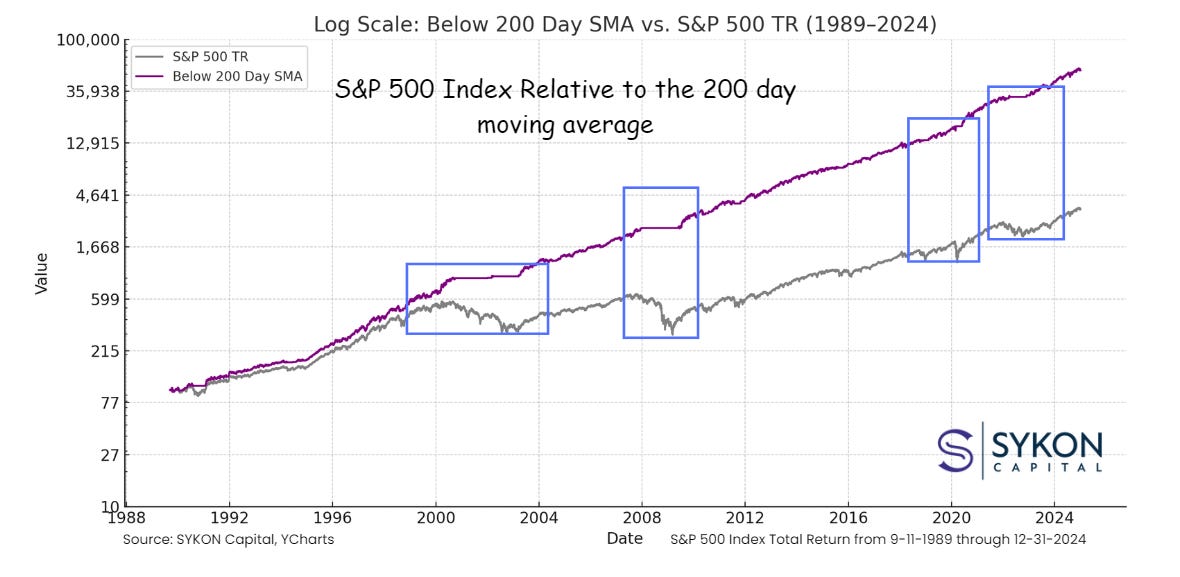
Here’s the setup we use:
Grey line = Total return of the index over time
Purple line = Return when the index is only above the 200-day SMA
The purple line doesn’t just look prettier, it’s less jagged, meaning lower drawdowns and smoother compounding.
Again, this isn’t a trading signal. You can’t invest directly in the index. But this framework can help reduce emotional decision-making and create structure in times of stress.
Think of it as a behavioral anchor, not a shortcut.
So… Should You Change Your Investing Strategy?
No. But you should review your process.
Investing isn’t binary. It’s not all-in or all-out. But market signals like this can serve as a check-in point, a time to reassess risk and identify better risk-reward setups.
Some of those opportunities right now?
International equities
Defensive sectors
High Quality Bonds
We’re making those adjustments for clients. That’s our job. But if you’re managing your own portfolio, ask yourself:
What’s your plan?
Because while there’s no one “right” process, not having one is the fastest path to poor outcomes.
And let’s be honest…
“Blindly buying the dip” isn’t a strategy.
It’s just a slogan, unless it’s grounded in a framework that helps you manage risk.
A well-calibrated risk management plan isn’t about reacting to every headline, it’s about having a consistent, evidence-based framework that adapts to changing market conditions while staying anchored to long-term goals. At SYKON, that means using tools like the 200-day moving average, trend strength, and volatility measures to tilt portfolios toward stronger risk-reward profiles. It’s not about going all in or all out, but making thoughtful, behaviorally informed adjustments that align with both market dynamics and the values driving each client’s financial plan
If this helped reframe how you're thinking about markets this week, please share it with someone else who's watching the S&P chop sideways and wondering what it all means.
Advisory Services offered through SYKON Capital LLC, a registered investment advisor with the U.S. Securities and Exchange Commission. This material is intended for informational purposes only. It should not be construed as legal or tax advice and is not intended to replace the advice of a qualified attorney or tax advisor. The information contained in this presentation has been compiled from third party sources and is believed to be reliable as of the date of this report. Past performance is not indicative of future returns and diversification neither assures a profit nor guarantees against loss in a declining market. Investments involve risk and are not guaranteed.