

In 2020, This Chart Pattern Destroyed Bond Portfolios. It May Be Back.
The market stopped pricing rate cuts and started pricing hikes. Is your allocation still living in last year’s playbook?

Something caught my attention this week that deserves more than a passing mention. We are watching a very similar sequence unfold in inflation data today that played out in 2020, the sequence that contributed to what many consider one of the worst multi-year stretches for bond investors in the Bloomberg Aggregate’s history [2]. I pulled three charts together because this is one of those inflection points where what you do next is important.
Let me start with a number: 300 basis points.
That was roughly where the market was pricing the terminal Fed Funds rate as recently as late 2025. I addressed how deep rate cuts were the consensus at the time. The market had essentially decided that the Fed was going to ease aggressively, and a lot of investor positioning reflected that expectation. Equity markets ran with it. Bond investors set up for falling yields. The narrative made sense to a lot of people at the time.
It may not make sense anymore.
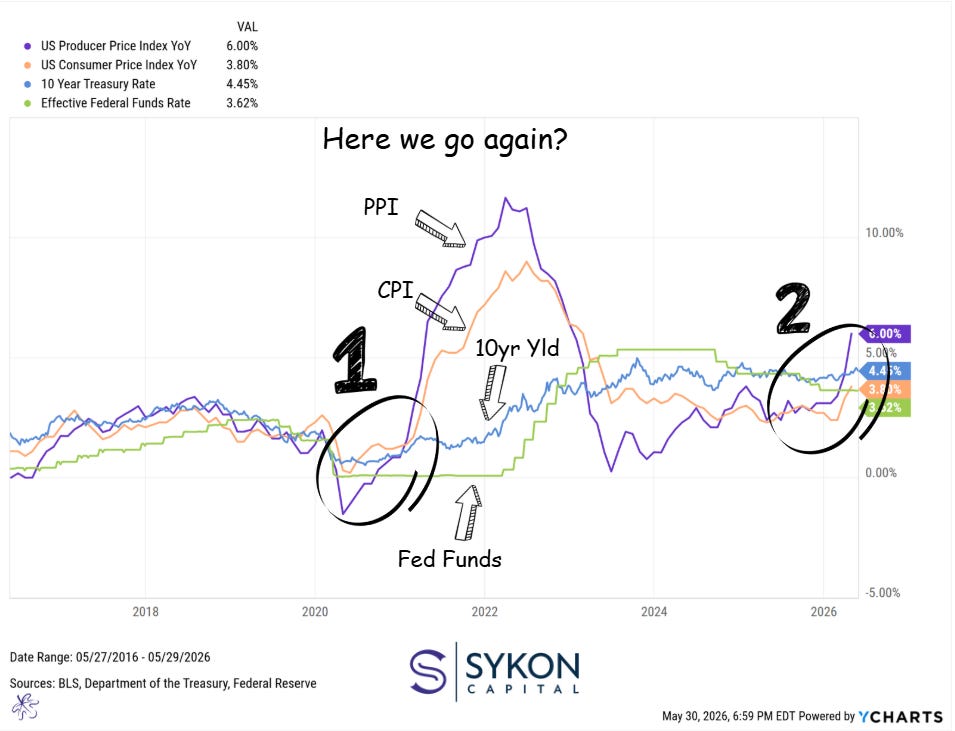
Chart 1: The same sequence that played out in 2020 is re-emerging. PPI at 6.00%, CPI at 3.80%, 10-Year Treasury at 4.45%, Effective Fed Funds at 3.62%.
Here We Go Again?
That is literally what I wrote on the chart above. Because when I look at what is happening with inflation data right now, I keep coming back to 2020. The sequence then is very similar to what we’re seeing today: Producer Price Index (PPI) turned up first, followed by Consumer Price Index (CPI), followed by Treasury yields climbing, and then the Fed eventually started tightening. It was all right there in the data, and most investors were still surprised when bond prices fell.
Today, PPI is running at 6.00% year-over-year [2]. CPI is at 3.80% [3]. The 10-year Treasury is at 4.45% [4]. And the Effective Fed Funds Rate is currently 3.62% [5]. Geopolitical pressures (including continued tensions in the Middle East) are contributing to commodity-side inflation, though the mechanism is similar to 2020: supply disruptions push into producer prices, which eventually flow through to consumers, which the Fed cannot ignore forever.
The question is whether investors are paying attention this time.
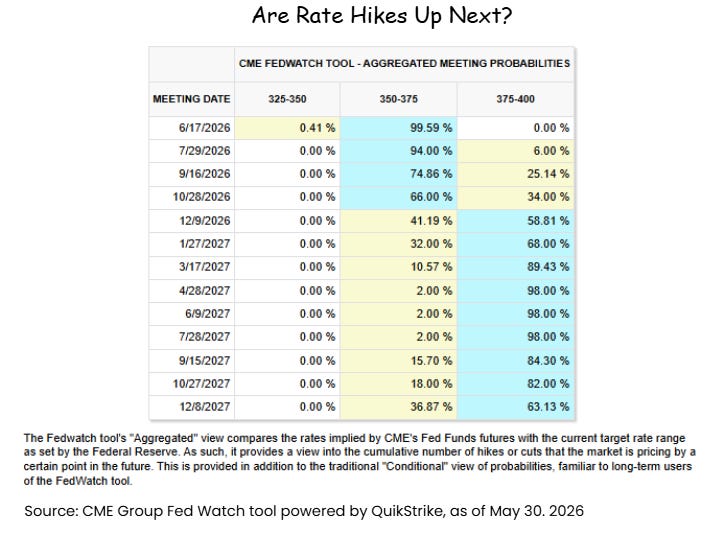
Chart 2: The market is now pricing a 58.81% probability of a 25bp rate hike to 375-400 by December 9, 2026. Six months ago, cuts were the unanimous expectation.
The Flip Nobody Saw Coming (Or Did They?)
Less than a year ago, the market was pricing terminal rates around 300 basis points. Today, the CME FedWatch Tool shows June 2026 at 99.59% probability of rates holding at 350-375. But look at December 9, 2026: 58.81% probability of a 25 basis point hike to the 375-400 range [6]. That’s about six months away.
We went from pricing aggressive cuts to pricing a hike. That is not a small shift. And it has real implications for every portfolio that was built for the easy-money environment we thought was coming.
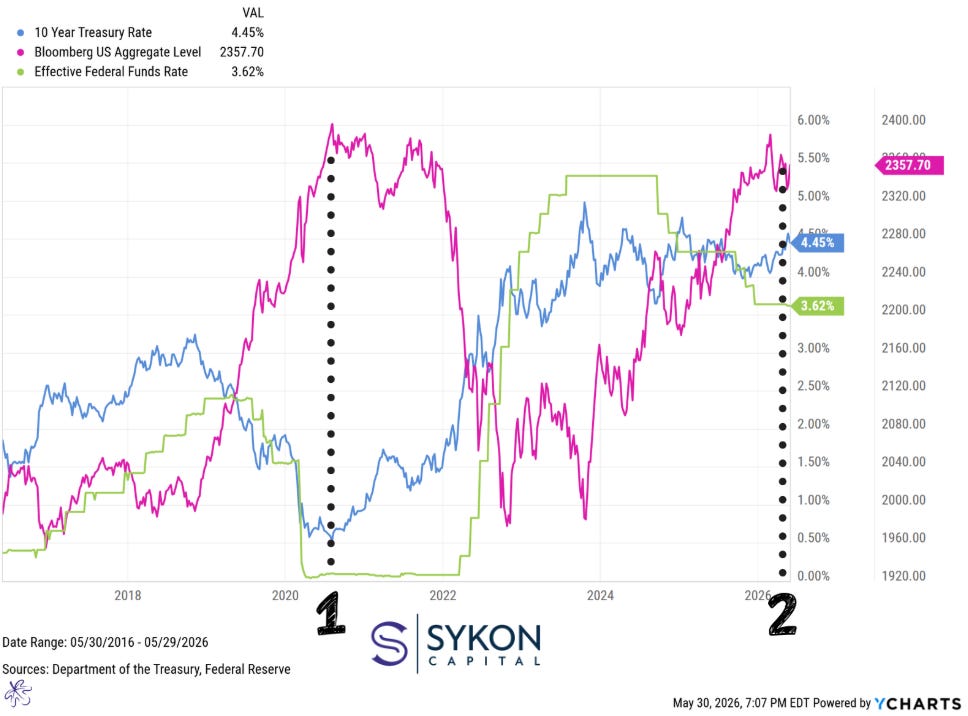
Chart 3: The Bloomberg US Aggregate sits at 2,357.70. That dotted line is not a prediction. It’s marking where we appear to be in the same cycle that preceded the 2021-2022 bond drawdown.
What Happened to the Agg Last Time
The Bloomberg US Aggregate Bond Index chart is the one that concerns me most. Line 1 shows what happened after the 2020 inflation surge: the Agg sold off sharply as yields climbed. We are now sitting at Line 2, with the Aggregate at 2,357.70, yields at 4.45%, and Fed Funds at 3.62%. The dotted vertical line marks today’s inflection point.
I want to be clear: this is not a prediction that the same thing happens again. Markets are rarely repeat. They do tend to rhyme. But if you are sitting in a passive Agg-tracking bond fund today, the question worth asking is whether you understand the duration risk you are carrying and what happens to that position if yields continue moving higher.
The Private Credit Problem in the Room
Here is the thing about private credit that I keep coming back to: a lot of investors moved into private credit as their diversifier precisely because they gave up on traditional fixed income. And I understand why. The Agg had a historically terrible run from 2021 to 2022.
But private credit is not a neutral substitute. Many of these borrowers issued debt during the 2020-2022 low-rate window on six-to-eight year cycles. They may be refinancing into a meaningfully higher rate environment around 2027 and 2028. Based on what I have been observing in the market, payment-in-kind (PIK) lending appears to be increasing across a number of private credit portfolios, which typically signals that cash interest coverage is under pressure for a meaningful subset of borrowers [8]. If defaults start to surface across private credit, the trickle effect through portfolios (both institutional and individual) could be more significant than most investors are currently pricing in.
Equities Are Expensive. Private Credit Is Stressed. So What Is the Diversifier?
By most conventional valuation measures, including trailing price-to-earnings ratios on the S&P 500, equities appear, in my view, to be trading at historically elevated levels [7]. Private credit is carrying refinancing risk that most investors are not fully pricing as indicated by the recently tight credit spreads. AI spending is accelerating, but data costs are also running in ways that may not be reflected in earnings yet, and tighter monetary policy historically compresses multiples.
The answer, in my view, is not that bonds are the problem. The answer is that the way we implement bonds may have been the problem.
Ritholtz and the Porterhouse Moment
Earlier this month, Ritholtz Wealth Management launched Porterhouse, a concentrated momentum equity SMA built in partnership with Franklin Templeton, a strategy built around the principle of targeting market leaders that are already moving higher [1]. This matters because Ritholtz has been one of the most vocal and principled advocates of passive, buy-and-hold investing for years.
In my view, this is a signal worth paying attention to: even firms with deeply held passive convictions are acknowledging that certain environments may reward a more dynamic approach.
I have been saying the same thing about fixed income for more than a decade.
Dynamic bond allocation is not a new concept. Adjusting duration exposure as the rate cycle shifts, rotating across credit quality and sector, managing inflation sensitivity. I have been doing this for clients for more than ten years. What feels different today is that the broader market is finally asking the questions that make this approach necessary.
Bonds are not dead. The 60/40 is not dead. But a static, passive, set-it-and-forget-it approach to fixed income (in an environment where inflation is re-emerging and the Fed may be preparing to hike) is a strategy worth reconsidering carefully.
Every portfolio is different, and how these dynamics affect yours depends on a lot of factors that are specific to your situation. If any of this raises questions you find yourself sitting with, feel free to reach out. I am always open to a conversation. You can find us at www.sykoncapital.com or drop me a note at todd@sykoncap.com. No pitch, just a discussion.
Sources:
[1] Business Wire. “Ritholtz Wealth Management Launches Porterhouse Equity SMA Strategy in Partnership with Franklin Templeton.” May 12, 2026. https://www.businesswire.com/news/home/20260512411348/en/Ritholtz-Wealth-Management-Launches-Porterhouse-Equity-SMA-Strategy-in-Partnership-with-Franklin-Templeton
[2] U.S. Bureau of Labor Statistics. “Producer Price Index: Final Demand.” Data as of May 2026. https://www.bls.gov/ppi/
[3] U.S. Bureau of Labor Statistics. “Consumer Price Index for All Urban Consumers (CPI-U).” Data as of May 2026. https://www.bls.gov/cpi/
[4] Federal Reserve Bank of St. Louis (FRED). “Market Yield on U.S. Treasury Securities at 10-Year Constant Maturity.” https://fred.stlouisfed.org/series/DGS10
[5] Federal Reserve Bank of St. Louis (FRED). “Effective Federal Funds Rate.” https://fred.stlouisfed.org/series/EFFR
[6] CME Group. “CME FedWatch Tool: Target Rate Probabilities.” As of May 30, 2026. https://www.cmegroup.com/markets/interest-rates/cme-fedwatch-tool.html
[7] S&P 500 trailing P/E and valuation data available at: https://www.multpl.com/s-p-500-pe-ratio and https://fred.stlouisfed.org/series/CAPE
[8] Author’s market observation. For reference on private credit stress indicators and PIK loan trends, see industry reports published by Pitchbook (https://pitchbook.com), Preqin (https://www.preqin.com), or S&P LCD (https://www.spglobal.com/marketintelligence/en/mi/products/leveraged-commentary-data.html).
Note: Bloomberg US Aggregate Index level (2,357.70) sourced from author’s proprietary YCharts terminal data as of May 30, 2026. YCharts is not publicly linkable but is verifiable via YCharts terminal subscription.
Questions Readers Are Asking
Should I still own bonds in 2026?
The short answer is: it depends on what kind of bonds and how they are managed. The case against bonds right now is really a case against passive, duration-heavy fixed income in a potentially rising-rate environment, not a case against bonds as an asset class. Treasury yields at 4.45% actually provide more income than investors have seen in several years. Shorter-duration bonds, inflation-linked securities, and actively managed fixed income strategies that can adjust as the rate cycle evolves offer very different profiles than a passive index fund tracking the Bloomberg US Aggregate. The question is not whether to own bonds, but whether the fixed income allocation you currently hold was designed to perform in this specific environment. In my experience, the answer is often no, not because bonds are broken, but because the strategy has not adapted to the current cycle.
What is the Ritholtz Porterhouse strategy and why does it matter for fixed income investors?
Porterhouse is a concentrated momentum equity separately managed account launched by Ritholtz Wealth Management in partnership with Franklin Templeton in May 2026. It is built around targeting market leaders that are already in an uptrend, a strategy often described as momentum investing. What makes this notable is that Ritholtz has long been associated with passive, buy-and-hold investment philosophy. Their decision to launch an active, concentrated momentum strategy signals something important: even the most principled passive advocates recognize that certain environments reward a more dynamic, tactical approach. For fixed income investors, the lesson is the same. If the most vocal buy-and-hold advocates in the equity world are pivoting toward active management in certain environments, it is worth asking whether the same pivot has been considered for the bond side of your portfolio, especially in a rate environment as uncertain as the current one.
What are payment-in-kind loans and why do they matter in a rising-rate environment?
Payment-in-kind (PIK) loans are a form of debt where the borrower pays interest not in cash but by adding to the principal balance, essentially deferring interest costs into the future. When PIK lending increases within a portfolio of private credit borrowers, it typically signals that the underlying companies may be experiencing cash flow pressure and cannot comfortably service their debt in cash. In a rising-rate environment, this dynamic becomes more problematic: companies that are already cash-strapped at today’s rates will face even higher debt service requirements if and when they refinance. Given that many private credit borrowers will likely need to refinance between 2027 and 2028 at materially higher rates than their original issuance, the increase in PIK lending today is an early warning indicator that deserves serious attention from investors who have significant private credit exposure in their portfolios.
Is the 60/40 portfolio still relevant when inflation is rising and the Fed may be hiking rates?
The 60/40 portfolio (broadly 60% equities and 40% bonds) was not designed to fail in rising-rate environments. It was designed to provide a balance between growth and stability across market cycles. The challenge in the current environment is that both legs of the 60/40 face headwinds simultaneously: equities are trading at historically elevated valuations, and a passive 40% bond allocation tracking the Bloomberg US Aggregate carries meaningful duration risk at a time when the Fed may be preparing to hike. The 60/40 is not broken as a concept. But a rigidly static implementation of it (one that does not adjust bond duration, sector exposure, or credit quality as conditions evolve) may not deliver the stability investors are counting on from the fixed income side. The framework is sound. The execution needs to be more dynamic.
If bonds aren’t dead, what specifically is wrong with how most people hold them?
Most investors hold bonds through broad index funds or passive allocations that track the Bloomberg US Aggregate Bond Index. The problem is not with those bonds themselves. It’s with the assumption that holding them passively across all rate environments is the right strategy. The Agg is heavily weighted toward longer-duration Treasuries and investment-grade corporate bonds, which are the most sensitive to rising rates. In a falling-rate environment, that duration exposure works in your favor. In a rising-rate environment, it works against you, sometimes significantly. Additionally, many investors have not revisited their fixed income strategy since the 2020-2022 drawdown, which means some are carrying the same passive positioning that hurt them then. A more intentional approach (one that adjusts duration, credit exposure, and sector allocation as the rate cycle shifts) is, in my view, how fixed income should be managed in an environment like this one.
Disclosures:
CFP® is a registered trademark of Certified Financial Planner Board of Standards, Inc. CMT® and Chartered Market Technician® are registered trademarks of CMT Association.
Advisory Services offered through SYKON Capital LLC, a Registered Investment Adviser with the U.S. Securities and Exchange Commission. This material is intended for informational purposes only. It should not be construed as legal or tax advice and is not intended to replace the advice of a qualified attorney or tax advisor. The information contained in this presentation has been compiled from third party sources and is believed to be reliable as of the date of this report. Sources are provided for informational purposes only. The author or firm may have a financial interest in the topics discussed. Past performance is not indicative of future returns and diversification neither assures a profit nor guarantees against loss in a declining market. Investments involve risk and are not guaranteed.